
Videos
(a)
To give: the equation of the least-squares regression line.
(a)
Answer to Problem 13PT
The equation of the least-squares regression line is
Explanation of Solution
Given:
Calculation:
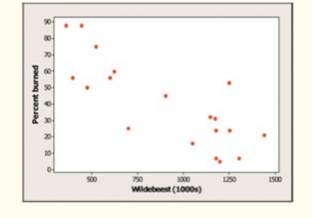
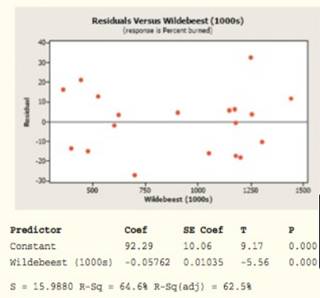
We think that “wildebeest” will help explain “percent burned”. So, “wildebeest” is the explanatory variable and “percent burned” is the response variable. From the out put we see that,
Y- Intercept = 92.29
Slope= -0.05762
Equation of least squares regression line is:
Percent burned
Conclusion:
Hence,the equation of the least-squares regression line is
(b)
To explain: the slope of the regression line
(b)
Answer to Problem 13PT
Slope is negative, we can say that every wildebeest abundance (in 1000s) increases percent of the grass burned decreases by 0.05762.
Explanation of Solution
The slope b of the regression line
Specifically, b is the predicted change in Y when X increases by 1 unit.
(c)
To find: The
(c)
Answer to Problem 13PT
The value of Correlation (r) is
Explanation of Solution
Calculation:
From the output we have,
The graph 1 shows a clear direction: The overall pattern moves from upper left to lower right.
That is, if wildebeest abundance increases, percent of the grass burned decreases. We call this a negative association between the two variables.
Conclusion:
Hence, the value of Correlation (r) is
This means a strong relationship between variables.
(d)
To find: whether a linear model is appropriatefor describing the relationship
(d)
Answer to Problem 13PT
A line does seem to be an appropriate model for these data.
Explanation of Solution
A line does seem to be an appropriate model for these data. The residual plot shows a fairly random scatter of points about the horizontal line representing error = 0. The residuals are between +30 to -30 except one point.
On average, predictions of percent of the grass burned would be off by about
That may be too much prediction error.
Chapter 3 Solutions
The Practice of Statistics for AP - 4th Edition
Additional Math Textbook Solutions
Essentials of Statistics, Books a la Carte Edition (5th Edition)
Basic Business Statistics, Student Value Edition (13th Edition)
Basic Business Statistics, Student Value Edition


 MATLAB: An Introduction with ApplicationsStatisticsISBN:9781119256830Author:Amos GilatPublisher:John Wiley & Sons Inc
 Probability and Statistics for Engineering and th...StatisticsISBN:9781305251809Author:Jay L. DevorePublisher:Cengage Learning
 Statistics for The Behavioral Sciences (MindTap C...StatisticsISBN:9781305504912Author:Frederick J Gravetter, Larry B. WallnauPublisher:Cengage Learning
 Elementary Statistics: Picturing the World (7th E...StatisticsISBN:9780134683416Author:Ron Larson, Betsy FarberPublisher:PEARSON
 The Basic Practice of StatisticsStatisticsISBN:9781319042578Author:David S. Moore, William I. Notz, Michael A. FlignerPublisher:W. H. Freeman
 Introduction to the Practice of StatisticsStatisticsISBN:9781319013387Author:David S. Moore, George P. McCabe, Bruce A. CraigPublisher:W. H. Freeman