
Videos
To describe: the shape of the distribution and any outliers.
Answer to Problem 33E
Shape: right skewed
Outliers: no
Center: median is 5.6mg
Spread:
Explanation of Solution
Given:
Calculation:
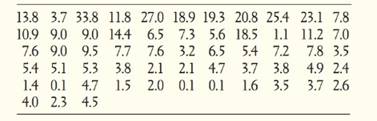
Consider the below table, for weights (in milligrams) of 58 diamonds.
| Class Interval | Tally Marks | x | Frequency (f) | Cumulative frequency(c.f.) |
| 0-2 | |||| || | 1 | 7 | 7 |
| 2-4 | |||| |||| |||| | 3 | 14 | 21 |
| 4-6 | |||| |||| | 5 | 10 | 31 |
| 6-8 | |||| |||| | 7 | 10 | 41 |
| 8-10 | |||| | 9 | 4 | 45 |
| 10-12 | ||| | 11 | 3 | 48 |
| 12-14 | | | 13 | 1 | 49 |
| 14-16 | | | 15 | 1 | 50 |
| 16-18 | 17 | 0 | 50 | |
| 18-20 | ||| | 19 | 3 | 53 |
| 20-22 | | | 21 | 1 | 54 |
| 22-24 | | | 23 | 1 | 55 |
| 24-26 | | | 25 | 1 | 56 |
| 26-28 | | | 27 | 1 | 57 |
| 28-30 | 29 | 0 | 57 | |
| 30-32 | 31 | 0 | 57 | |
| 32-34 | | | 33 | 1 | 58 |
| Total | 58 |
A histogram shows that the data are skewed right, not symmetric. Hence, the distribution of weights of these diamonds is skewed to right. The median would then be a better measure of the center.
It is clear in histogram that class 18-20 is an outlier because it that falls outside the overall pattern. The spread of a data set refers roughly to how wide be the data relative to its center. The
Range= Highest value- Lowest value
Cumulative frequency just greater than 29, is 31 and the class corresponding to 31 is 4-6 is median class. Median is obtained by the formula:
Where:
l is the lower limit of the median,
f is the frequency of the median class,
h is the magnitude of the median class,
c is the c.f. of the class preceding the median class,
and
Consider the following table:
| Class Interval | x | f | Cumulative frequency | fx |
| 0-2 | 1 | 7 | 7 | 7 |
| 2-4 | 3 | 14 | 21 | 42 |
| 4-6 | 5 | 10 | 31 | 50 |
| 6-8 | 7 | 10 | 41 | 70 |
| 8-10 | 9 | 4 | 45 | 36 |
| 10-12 | 11 | 3 | 48 | 33 |
| 12-14 | 13 | 1 | 49 | 13 |
| 14-16 | 15 | 1 | 50 | 15 |
| 16-18 | 17 | 0 | 50 | 0 |
| 18-20 | 19 | 3 | 53 | 57 |
| 20-22 | 21 | 1 | 54 | 21 |
| 22-24 | 23 | 1 | 55 | 23 |
| 24-26 | 25 | 1 | 56 | 25 |
| 26-28 | 27 | 1 | 57 | 27 |
| 28-30 | 29 | 0 | 57 | 0 |
| 30-32 | 31 | 1 | 57 | 0 |
| 32-34 | 33 | 1 | 58 | 33 |
| Total | = 58 |
The first quartile is the median of the data values below the median. Since there are 29 data values below the median, the first quartile is the
The third quartile is the median of the data values above the median. Since there are 29 data values above the median, the first quartile is the
The interquartile range IQR is the difference of the third and first quartile.
Shape: right skewed, because the highest bar in the histogram is to the left and the tall to the right.
Outliers: no, because there are no gaps in the histogram between bars.
Center: median is 5.6mg
Spread: interquartile range is 5.5mg
Conclusion:
Hence,
Shape: right skewed
Outliers: no
Center: median is 5.6mg
Spread: interquartile range is 5.5mg
Chapter 3 Solutions
The Practice of Statistics for AP - 4th Edition
Additional Math Textbook Solutions
An Introduction to Mathematical Statistics and Its Applications (6th Edition)
Statistics for Business and Economics (13th Edition)
STATS:DATA+MODELS-W/DVD
Essentials of Statistics (6th Edition)
Introductory Statistics (10th Edition)
Essentials of Statistics, Books a la Carte Edition (5th Edition)


 MATLAB: An Introduction with ApplicationsStatisticsISBN:9781119256830Author:Amos GilatPublisher:John Wiley & Sons Inc
 Probability and Statistics for Engineering and th...StatisticsISBN:9781305251809Author:Jay L. DevorePublisher:Cengage Learning
 Statistics for The Behavioral Sciences (MindTap C...StatisticsISBN:9781305504912Author:Frederick J Gravetter, Larry B. WallnauPublisher:Cengage Learning
 Elementary Statistics: Picturing the World (7th E...StatisticsISBN:9780134683416Author:Ron Larson, Betsy FarberPublisher:PEARSON
 The Basic Practice of StatisticsStatisticsISBN:9781319042578Author:David S. Moore, William I. Notz, Michael A. FlignerPublisher:W. H. Freeman
 Introduction to the Practice of StatisticsStatisticsISBN:9781319013387Author:David S. Moore, George P. McCabe, Bruce A. CraigPublisher:W. H. Freeman