The Practice of Statistics for AP - 4th Edition
4th Edition
ISBN: 9781429245593
Author: Starnes, Daren S., Yates, Daniel S., Moore, David S.
Publisher: Macmillan Higher Education
bartleby

Videos

Question
Book Icon
Chapter 3.1, Problem 3E

(a)

To determine

To find: whether the plot show a positive association or not

(a)

Expert Solution
Check Mark

Answer to Problem 3E

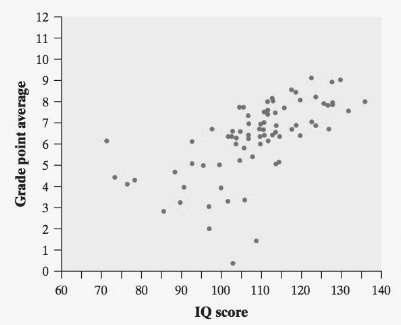
The plot shows a positive association between the two variables.

Explanation of Solution

Given:

  The Practice of Statistics for AP - 4th Edition, Chapter 3.1, Problem 3E , additional homework tip  1

Calculation:

The figure below shows a scatterplot of IQ scoresand grade point average. IQ scores will help in explaining “Grade point average”. So “IQ score” is the explanatory variable and “Grade point average” is the response variable. We want to see how grade point average changes when IQ score changes, so we put IQ score(the explanatory variable) on the horizontal axis and Grade point average (the response variable) on the vertical axis. Let’s take a closer look at the scatterplot from the figure.

The graph shows a clear direction: the overall pattern moves from lower left to upper right. That is, states in which students with higher IQ Scores tend to have Grade point average. We call this a positive association between the two variables.

(b)

To determine

To find:the form of the relationship and explain whether it is very strong or not

(b)

Expert Solution
Check Mark

Answer to Problem 3E

The form of the relationship is linear. The relationship is moderately strong

Explanation of Solution

The form of the relationship is linear. That is, the overall pattern follows a straight line from lower left to upper right. The relationship is moderately strong because the points don’t deviate greatly from line but there are some outliers.

(c)

To determine

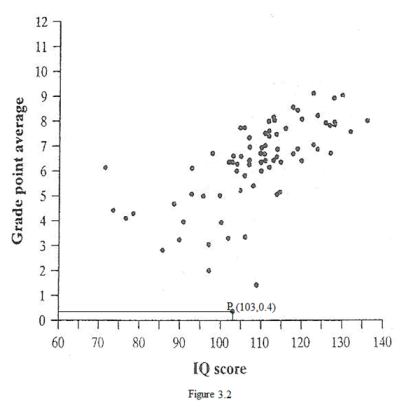
To find:the approximate IQ and GPA for the student

(c)

Expert Solution
Check Mark

Answer to Problem 3E

The student has IQscore 103 (approx.) but get GDP 0.4 (approx.)

Explanation of Solution

In Figure point P has a very low GPA despite an average IQ score. When we draw perpendiculars from point P to X axis and Y axis we see the coordinate of point P is approximately (103,0,4) . This shows that that student has IQ score 103 (approx.) but get GDP 0.4 (approx.).

  The Practice of Statistics for AP - 4th Edition, Chapter 3.1, Problem 3E , additional homework tip  2

Chapter 3 Solutions

The Practice of Statistics for AP - 4th Edition

Ch. 3.1 - Prob. 2ECh. 3.1 - Prob. 3ECh. 3.1 - Prob. 4ECh. 3.1 - Prob. 5ECh. 3.1 - Prob. 6ECh. 3.1 - Prob. 7ECh. 3.1 - Prob. 8ECh. 3.1 - Prob. 9ECh. 3.1 - Prob. 10ECh. 3.1 - Prob. 11ECh. 3.1 - Prob. 12ECh. 3.1 - Prob. 13ECh. 3.1 - Prob. 14ECh. 3.1 - Prob. 15ECh. 3.1 - Prob. 16ECh. 3.1 - Prob. 17ECh. 3.1 - Prob. 18ECh. 3.1 - Prob. 19ECh. 3.1 - Prob. 20ECh. 3.1 - Prob. 21ECh. 3.1 - Prob. 22ECh. 3.1 - Prob. 23ECh. 3.1 - Prob. 24ECh. 3.1 - Prob. 25ECh. 3.1 - Prob. 26ECh. 3.1 - Prob. 27ECh. 3.1 - Prob. 28ECh. 3.1 - Prob. 29ECh. 3.1 - Prob. 30ECh. 3.1 - Prob. 31ECh. 3.1 - Prob. 32ECh. 3.1 - Prob. 33ECh. 3.1 - Prob. 34ECh. 3.2 - Prob. 1.3CYUCh. 3.2 - Prob. 1.4CYUCh. 3.2 - Prob. 2.1CYUCh. 3.2 - Prob. 3.1CYUCh. 3.2 - Prob. 3.2CYUCh. 3.2 - Prob. 3.3CYUCh. 3.2 - Prob. 4.1CYUCh. 3.2 - Prob. 4.2CYUCh. 3.2 - Prob. 5.1CYUCh. 3.2 - Prob. 5.2CYUCh. 3.2 - Prob. 35ECh. 3.2 - Prob. 36ECh. 3.2 - Prob. 37ECh. 3.2 - Prob. 38ECh. 3.2 - Prob. 39ECh. 3.2 - Prob. 40ECh. 3.2 - Prob. 41ECh. 3.2 - Prob. 42ECh. 3.2 - Prob. 43ECh. 3.2 - Prob. 44ECh. 3.2 - Prob. 45ECh. 3.2 - Prob. 46ECh. 3.2 - Prob. 47ECh. 3.2 - Prob. 48ECh. 3.2 - Prob. 49ECh. 3.2 - Prob. 50ECh. 3.2 - Prob. 51ECh. 3.2 - Prob. 52ECh. 3.2 - Prob. 53ECh. 3.2 - Prob. 54ECh. 3.2 - Prob. 55ECh. 3.2 - Prob. 56ECh. 3.2 - Prob. 57ECh. 3.2 - Prob. 58ECh. 3.2 - Prob. 59ECh. 3.2 - Prob. 60ECh. 3.2 - Prob. 61ECh. 3.2 - Prob. 62ECh. 3.2 - Prob. 63ECh. 3.2 - Prob. 64ECh. 3.2 - Prob. 65ECh. 3.2 - Prob. 66ECh. 3.2 - Prob. 67ECh. 3.2 - Prob. 68ECh. 3.2 - Prob. 69ECh. 3.2 - Prob. 70ECh. 3.2 - Prob. 71ECh. 3.2 - Prob. 72ECh. 3.2 - Prob. 73ECh. 3.2 - Prob. 74ECh. 3.2 - Prob. 75ECh. 3.2 - Prob. 76ECh. 3.2 - Prob. 77ECh. 3.2 - Prob. 78ECh. 3.2 - Prob. 79ECh. 3.2 - Prob. 80ECh. 3.2 - Prob. 81ECh. 3 - Prob. 1CRECh. 3 - Prob. 2CRECh. 3 - Prob. 3CRECh. 3 - Prob. 4CRECh. 3 - Prob. 5CRECh. 3 - Prob. 6CRECh. 3 - Prob. 7CRECh. 3 - Prob. 1PTCh. 3 - Prob. 2PTCh. 3 - Prob. 3PTCh. 3 - Prob. 4PTCh. 3 - Prob. 5PTCh. 3 - Prob. 6PTCh. 3 - Prob. 7PTCh. 3 - Prob. 8PTCh. 3 - Prob. 9PTCh. 3 - Prob. 10PTCh. 3 - Prob. 11PTCh. 3 - Prob. 12PTCh. 3 - Prob. 13PT
Knowledge Booster
Background pattern image
Statistics
Learn more about
Need a deep-dive on the concept behind this application? Look no further. Learn more about this topic, statistics and related others by exploring similar questions and additional content below.
Recommended textbooks for you
Text book image
MATLAB: An Introduction with Applications
Statistics
ISBN:9781119256830
Author:Amos Gilat
Publisher:John Wiley & Sons Inc
Text book image
Probability and Statistics for Engineering and th...
Statistics
ISBN:9781305251809
Author:Jay L. Devore
Publisher:Cengage Learning
Text book image
Statistics for The Behavioral Sciences (MindTap C...
Statistics
ISBN:9781305504912
Author:Frederick J Gravetter, Larry B. Wallnau
Publisher:Cengage Learning
Text book image
Elementary Statistics: Picturing the World (7th E...
Statistics
ISBN:9780134683416
Author:Ron Larson, Betsy Farber
Publisher:PEARSON
Text book image
The Basic Practice of Statistics
Statistics
ISBN:9781319042578
Author:David S. Moore, William I. Notz, Michael A. Fligner
Publisher:W. H. Freeman
Text book image
Introduction to the Practice of Statistics
Statistics
ISBN:9781319013387
Author:David S. Moore, George P. McCabe, Bruce A. Craig
Publisher:W. H. Freeman
what is Research Design, Research Design Types, and Research Design Methods; Author: Educational Hub;https://www.youtube.com/watch?v=LpmGSioXxdo;License: Standard YouTube License, CC-BY