
Concept explainers
Videos
(a)
To make: a
(a)
Answer to Problem 11PT
Explanation of Solution
Given:
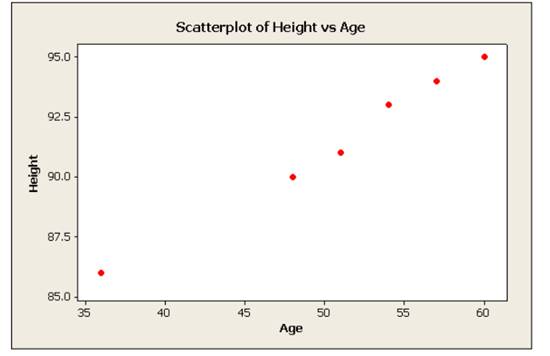
| Age | 36 | 48 | 51 | 54 | 57 | 60 |
| height | 86 | 90 | 91 | 93 | 94 | 95 |
Calculation:
The scatter plot for the given data is as follows

From the scatter plot, we can see that all points are showing a linear trend in upward direction. Hence, we can say that there exists a positive
Conclusion:
Hence,scatterplot is drawn.
(b)
To find: The equation of the least − squares regression line of height on age.
(b)
Answer to Problem 11PT
The least-square regression line is
Explanation of Solution
Calculation:
Here “age” is the explanatory variable and “height” is the response variable.
Using MINITAB, the output of the least − square regression line is obtained as follows.
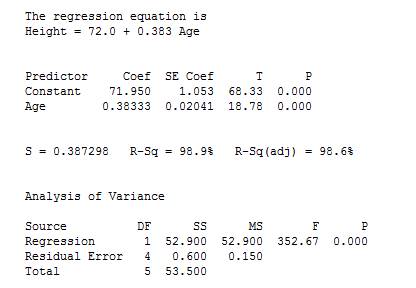
From the above output, the least-square regression line is given by
Conclusion:
Hence, the least-square regression line is
(c)
To predict: S’s height at age 40 years
(c)
Answer to Problem 11PT
S’s height will be 100.7677 inches.
Explanation of Solution
Calculation:
From part (b), the regression line between Age and Height is obtained as
Height = 71.95+0.0383 Age
Using the above regression line, we can predict Sarah’s height at age 40 years (480 months)
That is, the predicted Sarah’s height at age 40 years (480 months) will be,
Conclusion:
Hence, the predicted Sarah’s height at age 40 years (480 months) will be 100.7677 inches.(d)
To explain: why the prediction is impossibly large.
(d)
Answer to Problem 11PT
Predicting Sarah’s height at age 40 years (480 months) is an extrapolation of the relationship beyond what the data show.
Explanation of Solution
Age of 40 years (480 months) is far outside the set of X- values for our data. We cannot say whether the relationship remains linear at such extreme values. Predicting Sarah’s height at age 40 years (480 months) is an extrapolation of the relationship beyond what the data show. Hence, we can say that the predicted height is not accurate
Chapter 3 Solutions
The Practice of Statistics for AP - 4th Edition
Additional Math Textbook Solutions
Fundamentals of Statistics (5th Edition)
Intro Stats
An Introduction to Mathematical Statistics and Its Applications (6th Edition)
Introductory Statistics
Intro Stats, Books a la Carte Edition (5th Edition)
Statistical Reasoning for Everyday Life (5th Edition)


 MATLAB: An Introduction with ApplicationsStatisticsISBN:9781119256830Author:Amos GilatPublisher:John Wiley & Sons Inc
 Probability and Statistics for Engineering and th...StatisticsISBN:9781305251809Author:Jay L. DevorePublisher:Cengage Learning
 Statistics for The Behavioral Sciences (MindTap C...StatisticsISBN:9781305504912Author:Frederick J Gravetter, Larry B. WallnauPublisher:Cengage Learning
 Elementary Statistics: Picturing the World (7th E...StatisticsISBN:9780134683416Author:Ron Larson, Betsy FarberPublisher:PEARSON
 The Basic Practice of StatisticsStatisticsISBN:9781319042578Author:David S. Moore, William I. Notz, Michael A. FlignerPublisher:W. H. Freeman
 Introduction to the Practice of StatisticsStatisticsISBN:9781319013387Author:David S. Moore, George P. McCabe, Bruce A. CraigPublisher:W. H. Freeman