
Concept explainers
Videos
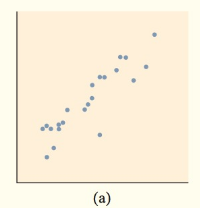
(a)
To match:the given graph to the
(a)
Answer to Problem 15E
The best
Explanation of Solution
Given:
Calculation:
The overall pattern in figure moves from lower left to upper right. We call this a positive association between the two variables. The form of the relationship is linear. That is, the overall pattern follows a straight line from lower left to upper right. The relationship is strong because the points don’t deviate greatly from line. When
Correlation
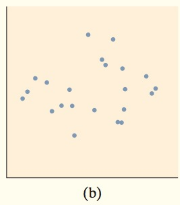
(b)
To match: the given graph to the
(b)
Answer to Problem 15E
The best Correlation is
Explanation of Solution
Given:
Calculation:
The overall pattern in figure (b) is not in line. The form of the relationship is not linear. The relationship is very weak because the points don’t show any relation. When scatterplot is comparedto the given figures, then
Correlation
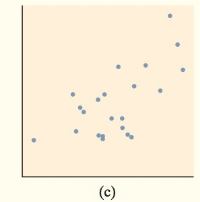
(c)
To match: the given graph to the
(c)
Answer to Problem 15E
The best Correlation is
Explanation of Solution
Given:
Calculation:
The overall pattern in figure(c) moves from lower left to upper right. We call this a positive association between the two variables. The form of the relationship is linear. That is, the overall pattern follows a straight line from lower left to upper right. The relationship is not very strong because the points deviate greatly from line. When scatterplot is comparedto the given figures, then
Correlation
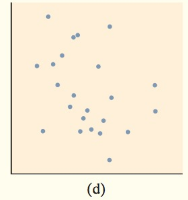
(d)
To match: the given graph to the
(d)
Answer to Problem 15E
The best Correlation is
Explanation of Solution
Given:
Calculation:
The overall pattern in figure (d) moves from upper left to lower right. We call this a negative association between the two variables. The form of the relationship is linear. That is, the overall pattern follows a straight line from upper left to lower right. The relationship is very weak because the points deviate greatly from line. When scatterplot is comparedto the given figures, then
Correlation
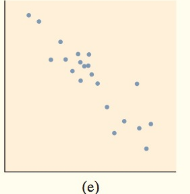
(e)
To match: the given graph to the
(e)
Answer to Problem 15E
The best Correlation is
Explanation of Solution
Given:
Calculation:
The overall pattern in figure moves from upper left to lower right. We call this a negative association between the two variables. The form of the relationship is linear. That is, the overall pattern follows a straight line from upper left to lower right. The relationship is very strong because the points don’t deviate greatly from line. When scatterplot is comparedto the given figures, then
Correlation
Chapter 3 Solutions
The Practice of Statistics for AP - 4th Edition
Additional Math Textbook Solutions
Elementary Statistics: Picturing the World (7th Edition)
Introductory Statistics
Elementary Statistics
STATS:DATA+MODELS-W/DVD
Elementary Statistics: Picturing the World (6th Edition)


 MATLAB: An Introduction with ApplicationsStatisticsISBN:9781119256830Author:Amos GilatPublisher:John Wiley & Sons Inc
 Probability and Statistics for Engineering and th...StatisticsISBN:9781305251809Author:Jay L. DevorePublisher:Cengage Learning
 Statistics for The Behavioral Sciences (MindTap C...StatisticsISBN:9781305504912Author:Frederick J Gravetter, Larry B. WallnauPublisher:Cengage Learning
 Elementary Statistics: Picturing the World (7th E...StatisticsISBN:9780134683416Author:Ron Larson, Betsy FarberPublisher:PEARSON
 The Basic Practice of StatisticsStatisticsISBN:9781319042578Author:David S. Moore, William I. Notz, Michael A. FlignerPublisher:W. H. Freeman
 Introduction to the Practice of StatisticsStatisticsISBN:9781319013387Author:David S. Moore, George P. McCabe, Bruce A. CraigPublisher:W. H. Freeman