
Concept explainers
Videos
(a)
To find: the equation of the least-squares regression line
(a)
Answer to Problem 63E
The equation of the least-squares regression line is
There are
Explanation of Solution
Given:
Calculation:
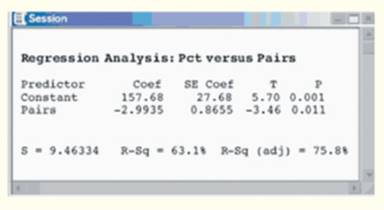
From the above figure we can clearly see that
Thus, the equation of the least-squares regression line is
The study records the percent of males (banded for identification) that returned the next breeding. This is the outcome of the study; the percent return is the response variable. Now, breeding pairs is a second variable. The entire purpose of the study is to determine how, if at all, breeding pairs affect the percent return. Breeding pairs is an explanatory variable. We will use breeding pairs (explanatory variable or predictor) to predict percent return (response or predicted variable). Percent return is the dependent variable and breeding pairs is the independent variable. The equation of the least-squares regression line for predicting the percent of males that return from the number of breeding pairs is.
Percent return
The percent of returning males after a season with 30 breeding pairs is,
There are
Conclusion:
Therefore, the equation of the least-squares regression line is
There are
(b)
To find: percentage of variation explained by the regression line
(b)
Answer to Problem 63E
The percentage of variation explained by the regression line is
Explanation of Solution
Calculation:
From the above figure we can clearly see that
We interpret this by saying that
Conclusion:
Therefore, the percentage of variation explained by the regression line is
(c)
To find: the
(c)
Answer to Problem 63E
Percent of returning males and breeding pairs are
Explanation of Solution
Calculation:
From the above figure we can clearly see that
This shows negative correlation between variables.
Percent of returning males and breeding pairs are negatively correlated and the coefficient of correlation between them is
Conclusion:
Therefore, percent of returning males and breeding pairs are negatively correlated and the coefficient of correlation between them is
(d)
To interpret: the value of s
(d)
Answer to Problem 63E
The predication of the percent returning is varied by about
Explanation of Solution
Calculation:
For these data the standard deviation of the residuals:
The standard deviation of the residuals s measures the average size of the prediction errors (residuals) when using the regression line,
Conclusion: Therefore, the predication of the percent returning is varied by about
Chapter 3 Solutions
The Practice of Statistics for AP - 4th Edition
Additional Math Textbook Solutions
Statistics: The Art and Science of Learning from Data (4th Edition)
Statistics for Psychology
Elementary Statistics: Picturing the World (6th Edition)
Introductory Statistics (10th Edition)
STATS:DATA+MODELS-W/DVD
Elementary Statistics (13th Edition)


 MATLAB: An Introduction with ApplicationsStatisticsISBN:9781119256830Author:Amos GilatPublisher:John Wiley & Sons Inc
 Probability and Statistics for Engineering and th...StatisticsISBN:9781305251809Author:Jay L. DevorePublisher:Cengage Learning
 Statistics for The Behavioral Sciences (MindTap C...StatisticsISBN:9781305504912Author:Frederick J Gravetter, Larry B. WallnauPublisher:Cengage Learning
 Elementary Statistics: Picturing the World (7th E...StatisticsISBN:9780134683416Author:Ron Larson, Betsy FarberPublisher:PEARSON
 The Basic Practice of StatisticsStatisticsISBN:9781319042578Author:David S. Moore, William I. Notz, Michael A. FlignerPublisher:W. H. Freeman
 Introduction to the Practice of StatisticsStatisticsISBN:9781319013387Author:David S. Moore, George P. McCabe, Bruce A. CraigPublisher:W. H. Freeman