
Concept explainers
Videos
(a)
To make: a
(a)
Answer to Problem 65E

Explanation of Solution
Given:
| airline | Outsource percent | Delay percent |
| AirTran | 66 | 14 |
| Alaska | 92 | 42 |
| American | 46 | 26 |
| America west | 76 | 39 |
| ATA | 18 | 19 |
| Continental | 69 | 20 |
| Delta | 48 | 26 |
| Frontier | 65 | 31 |
| Hawaiian | 80 | 70 |
| JetBlue | 68 | 18 |
| Northwest | 76 | 43 |
| Southwest | 68 | 20 |
| United | 63 | 27 |
| US airways | 77 | 24 |
Calculation:
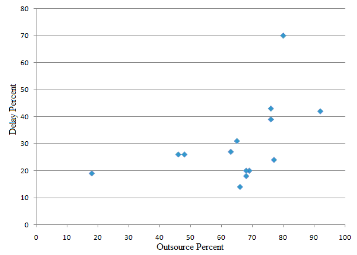
Put outsource percent (the explanatory variable) on the horizontal axis and delay percent (the response variable) on the vertical axis. The below figure is our completed scatterplot.
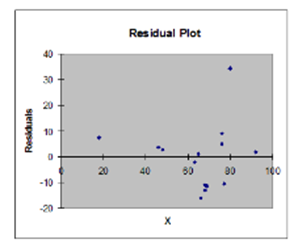
The figure below shows residual plot for the regression. A Hawaiian airline is an outlier because it has largest residual.
Conclusion:
Therefore, the required scatterplot is drawn.
(b)
To find: the
(b)
Answer to Problem 65E
r (with Hawaiian airlines) = 0.4765
r (with Hawaiian airlines) = 0.4838
Explanation of Solution
Calculation:
By using calculator, we get correlation r with Hawaiian airlines is r (with Hawaiian airlines) = 0.4765
And correlation r without Hawaiian airlines is r (with Hawaiian airlines) = 0.4838
Correlation increases by 0.0073 without Hawaiian airlines. However, removing Hawaiian airlines has little effect on the correlation. Because of Hawaiian airline's extreme position on outsource percent scale; this point has a strong influence on the position of the regression line.
Conclusion:
Therefore, correlation with Hawaiian airlines is 0.4765 and correlation with Hawaiian airlines is 0.4838
(c)
To find: the least squares line
(c)
Answer to Problem 65E
Predicted
Explanation of Solution
Calculation:
The below figure shows least squares lines for predicting Y from X with and without Hawaiian airlines.
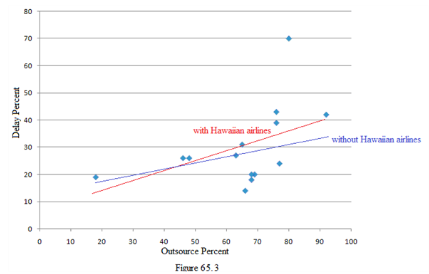
You can see that removing the point Hawaiian airlines moves the line quite a bit. Because of Hawaiian airline's extreme position on outsource percent scale; this point has a strong influence on the position of the regression line. However, removing Hawaiian airlines has a little effect on the regression line. By using calculator, we get the linear equations of regression with and without Hawaiian airlines are,
Predicted
Predicted
Predicted percent of delays blamed on an airline that has outsourced 76% of its major maintenance is,
Predicted
Predicted
Conclusion:
Therefore, predicted
Chapter 3 Solutions
The Practice of Statistics for AP - 4th Edition
Additional Math Textbook Solutions
Elementary Statistics (13th Edition)
Introductory Statistics (10th Edition)
Introductory Statistics
Essentials of Statistics, Books a la Carte Edition (5th Edition)
Fundamentals of Statistics (5th Edition)
Elementary Statistics Using Excel (6th Edition)


 MATLAB: An Introduction with ApplicationsStatisticsISBN:9781119256830Author:Amos GilatPublisher:John Wiley & Sons Inc
 Probability and Statistics for Engineering and th...StatisticsISBN:9781305251809Author:Jay L. DevorePublisher:Cengage Learning
 Statistics for The Behavioral Sciences (MindTap C...StatisticsISBN:9781305504912Author:Frederick J Gravetter, Larry B. WallnauPublisher:Cengage Learning
 Elementary Statistics: Picturing the World (7th E...StatisticsISBN:9780134683416Author:Ron Larson, Betsy FarberPublisher:PEARSON
 The Basic Practice of StatisticsStatisticsISBN:9781319042578Author:David S. Moore, William I. Notz, Michael A. FlignerPublisher:W. H. Freeman
 Introduction to the Practice of StatisticsStatisticsISBN:9781319013387Author:David S. Moore, George P. McCabe, Bruce A. CraigPublisher:W. H. Freeman