
Concept explainers
Videos
(a)
To describe: the direction, form, and strength
(a)
Answer to Problem 7E
Direction: positive
Form: linear
Strength: moderately strong
Explanation of Solution
Calculation:
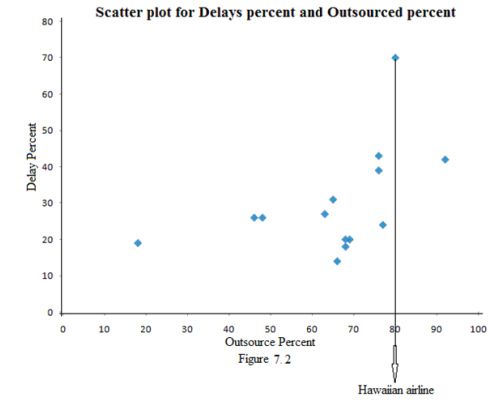
Put outsource percent (the explanatory variable) on the horizontal axis and delay percent (the response variable) on the vertical axis. Figure

The graph shows a positive direction: the overall pattern moves from lower left to upper right. That is, states in which students with higher outsource percent tend to have higher delay percent. This refers to positive association between the two variables. The form of the relationship is linear. The graph follows a straight line pattern . The relationship is moderately strong because the points don’t deviate greatly from line but there are some outliers.
Conclusion:
Therefore,
Direction: positive
Form: linear
Strength: moderately strong
(b)
To find:the airlines which are a high outlier in delay percent and explain the plot which shows a roughly linear form and the relationship is strong or not
(b)
Answer to Problem 7E
This is Hawaiian airline is a high outlier in delay percent
The overall pattern follows a straight line from lower left to upper right. The relationship is not very strong because the points deviate greatly from line and there are some outliers.
Explanation of Solution
The airline with delay percent
Chapter 3 Solutions
The Practice of Statistics for AP - 4th Edition
Additional Math Textbook Solutions
Intro Stats
Statistics: The Art and Science of Learning from Data (4th Edition)
Statistics for Psychology
Elementary Statistics (13th Edition)
Elementary Statistics
Introductory Statistics (10th Edition)


 MATLAB: An Introduction with ApplicationsStatisticsISBN:9781119256830Author:Amos GilatPublisher:John Wiley & Sons Inc
 Probability and Statistics for Engineering and th...StatisticsISBN:9781305251809Author:Jay L. DevorePublisher:Cengage Learning
 Statistics for The Behavioral Sciences (MindTap C...StatisticsISBN:9781305504912Author:Frederick J Gravetter, Larry B. WallnauPublisher:Cengage Learning
 Elementary Statistics: Picturing the World (7th E...StatisticsISBN:9780134683416Author:Ron Larson, Betsy FarberPublisher:PEARSON
 The Basic Practice of StatisticsStatisticsISBN:9781319042578Author:David S. Moore, William I. Notz, Michael A. FlignerPublisher:W. H. Freeman
 Introduction to the Practice of StatisticsStatisticsISBN:9781319013387Author:David S. Moore, George P. McCabe, Bruce A. CraigPublisher:W. H. Freeman