
Videos
To make:a
Answer to Problem 5E
The result is:
Explanation of Solution
Given:
| Airline | Outsource percent | Delay percent |
| AirTran | ||
| Alaska | ||
| American | ||
| America West | ||
| ATA | ||
| Continental | ||
| delta | ||
| Hawaiian | ||
| JetBlue | ||
| Northwest | ||
| Southwest | ||
| United | ||
| US Airways |
Calculation:
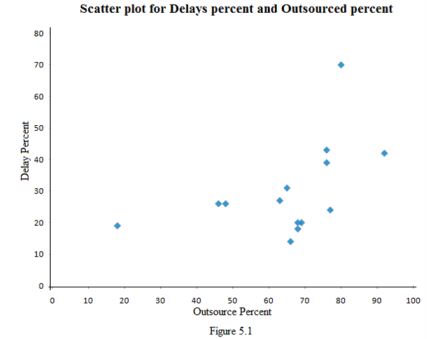
We put outsource percent (the explanatory variable) on the horizontal axis and delay percent (the response variable) on the vertical axis. Figure

From the scatter plot, we can conclude that there is positive correlation exists between percent of major maintenance outsourced and percent of flight delays blamed on the airline. So, we reject the critics claim and we can conclude that the Airlines have increasingly outsourced the maintenance of their planes to other companies.
Conclusion:
Therefore, the scatterplot is drawn.
Chapter 3 Solutions
The Practice of Statistics for AP - 4th Edition
Additional Math Textbook Solutions
Fundamentals of Statistics (5th Edition)
Intro Stats
Elementary Statistics Using Excel (6th Edition)
Elementary Statistics: Picturing the World (6th Edition)
Basic Business Statistics, Student Value Edition


 MATLAB: An Introduction with ApplicationsStatisticsISBN:9781119256830Author:Amos GilatPublisher:John Wiley & Sons Inc
 Probability and Statistics for Engineering and th...StatisticsISBN:9781305251809Author:Jay L. DevorePublisher:Cengage Learning
 Statistics for The Behavioral Sciences (MindTap C...StatisticsISBN:9781305504912Author:Frederick J Gravetter, Larry B. WallnauPublisher:Cengage Learning
 Elementary Statistics: Picturing the World (7th E...StatisticsISBN:9780134683416Author:Ron Larson, Betsy FarberPublisher:PEARSON
 The Basic Practice of StatisticsStatisticsISBN:9781319042578Author:David S. Moore, William I. Notz, Michael A. FlignerPublisher:W. H. Freeman
 Introduction to the Practice of StatisticsStatisticsISBN:9781319013387Author:David S. Moore, George P. McCabe, Bruce A. CraigPublisher:W. H. Freeman