
Concept explainers
Videos
(a)
To make:a
(a)
Answer to Problem 20E
Explanation of Solution
Given:

Calculation:
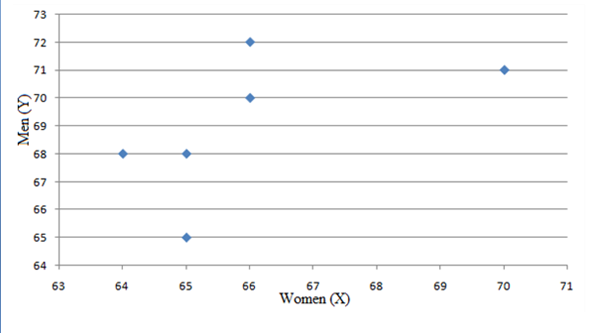
It is assumed that women’s height (X) will help explain men’s height (Y). So, women’s height (x) is the explanatory variable and men’s height (Y) is the response variable. We want to see men’s height (Y) changes when women’s height (X) changes, so we put women’s height X (the explanatory variable) on the horizontal axis and men’s height Y (the response variable) on the vertical axis.
Using EXCEL, the scatterplot for the given data is,

The overall pattern moves from lower left to upper right. We call this a positive association between the two variables. The form of the relationship is linear. That is, the overall pattern follows a straight line form lower left to upper right. The relationship is moderately strong; we cannot expect
Conclusion:
Hence, scatterplot is drawn.
(b)
To find:the correlation and explain whether the data shows that taller women tend to date taller men.
(b)
Answer to Problem 20E
Hence,
the correlation of 0.57 confirms in the scatter plot: there is moderately strong, positive relationship between two variables.
The value of correlation is 0.57
Explanation of Solution
Calculation:
We find the correlation coefficient is given as follows:
Where
Consider the following table:
| X | Y | ||||||
| 66 | 72 | 0.0 | 9.0 | 0.00 | 1.19 | 0.00 | |
| 64 | 68 | 4.0 | 1.0 | -0.95 | -0.40 | 0.38 | |
| 66 | 70 | 0.0 | 1.0 | 0.00 | 0.40 | 0.00 | |
| 65 | 68 | 1.0 | 1.0 | -0.48 | -0.40 | 0.19 | |
| 70 | 71 | 16.0 | 4.0 | 1.91 | 0.79 | 1.51 | |
| 65 | 65 | 1.0 | 16.0 | -0.48 | -1.58 | 0.75 | |
| Total | 396 | 414 | 22 | 32 | 0.00 | 0.00 | 2.83 |
=66.0
=69.0
=2.1
=2.5
= 0.57
The correlation of 0.57 confirms in the scatter plot: there is moderately strong, positive relationship between two variables. Removing the outlier (70, 71) would increase the correlation because remaining 5 points are tightly clustered in a linear pattern.
Conclusion:
Hence, the correlation of 0.57 confirms in the scatter plot: there is moderately strong, positive relationship between two variables.
The value of correlation is 0.57
Chapter 3 Solutions
The Practice of Statistics for AP - 4th Edition
Additional Math Textbook Solutions
Elementary Statistics: Picturing the World (6th Edition)
Statistics for Business and Economics (13th Edition)
Essentials of Statistics (6th Edition)
Statistics: The Art and Science of Learning from Data (4th Edition)
Elementary Statistics: Picturing the World (7th Edition)
Introductory Statistics (10th Edition)


 MATLAB: An Introduction with ApplicationsStatisticsISBN:9781119256830Author:Amos GilatPublisher:John Wiley & Sons Inc
 Probability and Statistics for Engineering and th...StatisticsISBN:9781305251809Author:Jay L. DevorePublisher:Cengage Learning
 Statistics for The Behavioral Sciences (MindTap C...StatisticsISBN:9781305504912Author:Frederick J Gravetter, Larry B. WallnauPublisher:Cengage Learning
 Elementary Statistics: Picturing the World (7th E...StatisticsISBN:9780134683416Author:Ron Larson, Betsy FarberPublisher:PEARSON
 The Basic Practice of StatisticsStatisticsISBN:9781319042578Author:David S. Moore, William I. Notz, Michael A. FlignerPublisher:W. H. Freeman
 Introduction to the Practice of StatisticsStatisticsISBN:9781319013387Author:David S. Moore, George P. McCabe, Bruce A. CraigPublisher:W. H. Freeman