
Concept explainers
Videos
(a)
To make: a residual plot and describe how the line fits the data.
(a)
Answer to Problem 55E

Explanation of Solution
Calculation:
The below figure shows the residual plot for the given data:
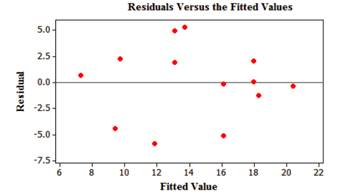
The above figure shows a residual plot with an unstructured (random) scatter of points in a horizontal band centered at zero. Most of the residuals are between
Conclusion:
Thus, the residual plot is plotted.
(b)
To find: the point which has the largest residual
(b)
Answer to Problem 55E
The point
Explanation of Solution
Calculation:
The below table shows values of predicted Y and residuals
| Percent return (X) | New adults (Y) | Predicted Y (Y) | Residuals(Y-Y) |
| 74 | 5 | 9.43656125 |
|
| 66 | 6 | 11.86874481 |
|
| 81 | 8 | 7.308400634 |
|
| 52 | 11 | 16.12506604 |
|
| 73 | 12 | 9.740584195 |
|
| 62 | 15 | 13.08483659 |
|
| 52 | 16 | 16.12506604 |
|
| 45 | 17 | 18.25322666 |
|
| 62 | 18 | 13.08483659 |
|
| 46 | 18 | 17.94920371 |
|
| 60 | 19 | 13.69288248 |
|
| 46 | 20 | 17.94920371 |
|
| 38 | 20 | 20.38138727 |
|
From the table,the point
Conclusion:
Therefore, the point
Chapter 3 Solutions
The Practice of Statistics for AP - 4th Edition
Additional Math Textbook Solutions
Essentials of Statistics, Books a la Carte Edition (5th Edition)
Introductory Statistics
Fundamentals of Statistics (5th Edition)
Introductory Statistics
Elementary Statistics: Picturing the World (6th Edition)


 MATLAB: An Introduction with ApplicationsStatisticsISBN:9781119256830Author:Amos GilatPublisher:John Wiley & Sons Inc
 Probability and Statistics for Engineering and th...StatisticsISBN:9781305251809Author:Jay L. DevorePublisher:Cengage Learning
 Statistics for The Behavioral Sciences (MindTap C...StatisticsISBN:9781305504912Author:Frederick J Gravetter, Larry B. WallnauPublisher:Cengage Learning
 Elementary Statistics: Picturing the World (7th E...StatisticsISBN:9780134683416Author:Ron Larson, Betsy FarberPublisher:PEARSON
 The Basic Practice of StatisticsStatisticsISBN:9781319042578Author:David S. Moore, William I. Notz, Michael A. FlignerPublisher:W. H. Freeman
 Introduction to the Practice of StatisticsStatisticsISBN:9781319013387Author:David S. Moore, George P. McCabe, Bruce A. CraigPublisher:W. H. Freeman