
Concept explainers
Videos
(a)
To find: The slope of the line
(a)
Answer to Problem 40E
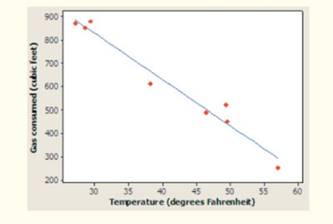
The slope is b = -19.87
Explanation of Solution
Given:
The equation of the least squares line is
Calculation:
On comparing our equation to general equation of regression we get, the slope is: b = -19.87
This tells us that the gas consumed is predicted to go down by -19.87cubic feet for each added temperature.
Conclusion:
Hence, the slope is: b = -19.87.
(b)
To identify: the y intercept of the line and explain why the y intercept is risky to use.
(b)
Answer to Problem 40E
The Y intercept is: a = 1425
Explanation of Solution
Calculation:
On comparing our equation to general equation of regression we get, the Y intercept is:
The Y intercept of a regression line
Conclusion:
Hence, the Y intercept is:
This prediction is of no statistical use unless X can actually take values near 0 that’s why it’s risky to use this value as a prediction.
(c)
To predict: the amount of natural gas Joan will use in a month
(c)
Answer to Problem 40E
Joan uses 828.9 cubic gas.
Explanation of Solution
Calculation:
The regression line is:
At temperature (X) =
This shows that Joan uses 828.9 cubic feet gas (approx.) to maintain the temperature 30 degrees Fahrenheit.
Conclusion:
Hence, Joan uses 828.9 cubic feet gas (approx).
Chapter 3 Solutions
The Practice of Statistics for AP - 4th Edition
Additional Math Textbook Solutions
Introductory Statistics (2nd Edition)
Elementary Statistics (13th Edition)
Elementary Statistics Using Excel (6th Edition)
Intro Stats, Books a la Carte Edition (5th Edition)
Statistics: The Art and Science of Learning from Data (4th Edition)
Elementary Statistics: Picturing the World (6th Edition)


 MATLAB: An Introduction with ApplicationsStatisticsISBN:9781119256830Author:Amos GilatPublisher:John Wiley & Sons Inc
 Probability and Statistics for Engineering and th...StatisticsISBN:9781305251809Author:Jay L. DevorePublisher:Cengage Learning
 Statistics for The Behavioral Sciences (MindTap C...StatisticsISBN:9781305504912Author:Frederick J Gravetter, Larry B. WallnauPublisher:Cengage Learning
 Elementary Statistics: Picturing the World (7th E...StatisticsISBN:9780134683416Author:Ron Larson, Betsy FarberPublisher:PEARSON
 The Basic Practice of StatisticsStatisticsISBN:9781319042578Author:David S. Moore, William I. Notz, Michael A. FlignerPublisher:W. H. Freeman
 Introduction to the Practice of StatisticsStatisticsISBN:9781319013387Author:David S. Moore, George P. McCabe, Bruce A. CraigPublisher:W. H. Freeman