
Concept explainers
Videos
Predict the percentage of the population that will be
Answer to Problem 3E
Explanation of Solution
Given information:
The graph indicates how Australia’s population is aging by showing the past and projected percentage of the population aged
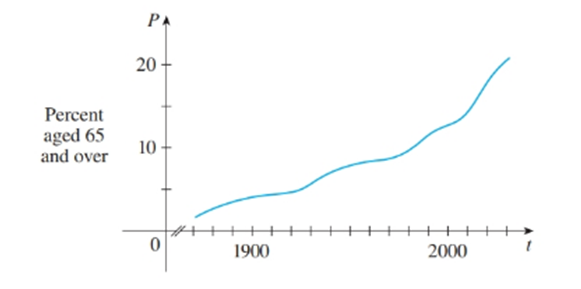
Calculation:

From the graph ot is observed that,
In
In
In
In
In
With this information we can say, if ypu use linear equation to predict the chamge in population then your estimate will be too low.
In this first four the number is increasing slowly.
In the last one it is increasing rapidly.
Because the numbers are increasing at a varying rate you cannot predict with a linear graph.
Think of the graph
It increases slowly at first then faster.
If you used a linear equation on that it would predict numbers lower than the actual equation.
If
From the graph we have
Estimate
With this estimate the linear approximation for the population in the year
Estimate
With this estimate the linear approximation for the population in the year
Hence the linear approximation gives the value
Hence, the predicted percentages of the population aged
Chapter 3 Solutions
Single Variable Calculus: Concepts and Contexts, Enhanced Edition


 Calculus: Early TranscendentalsCalculusISBN:9781285741550Author:James StewartPublisher:Cengage Learning
 Thomas' Calculus (14th Edition)CalculusISBN:9780134438986Author:Joel R. Hass, Christopher E. Heil, Maurice D. WeirPublisher:PEARSON
 Calculus: Early Transcendentals (3rd Edition)CalculusISBN:9780134763644Author:William L. Briggs, Lyle Cochran, Bernard Gillett, Eric SchulzPublisher:PEARSON
 Calculus: Early TranscendentalsCalculusISBN:9781319050740Author:Jon Rogawski, Colin Adams, Robert FranzosaPublisher:W. H. Freeman
 Calculus: Early Transcendental FunctionsCalculusISBN:9781337552516Author:Ron Larson, Bruce H. EdwardsPublisher:Cengage Learning