Concept explainers
Videos
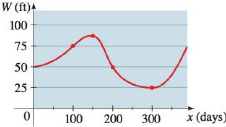
Changing Water Levels The graph shows the depth of water W in a reservoir over a one-year period as a function of the number of days x since the beginning of the year. What was the average rate of change of W between x = 100 and x = 200?
To find: The average rate of change of water between
Answer to Problem 23E
The average rate of change of water between
Explanation of Solution
Given:
The given graphs is,
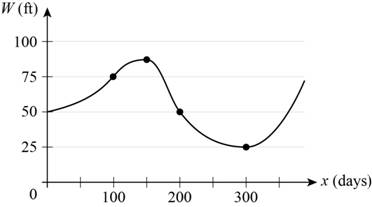
Figure (1)
Formula used:
Average rate of change of function
Calculation:
The given graph shows the depth of the water in a reservoir over a one-year period as a function of number of days x.
From the given graph, for
Substitute 50 for
Therefore, the average rate of change of water between
Chapter 2 Solutions
Precalculus: Mathematics for Calculus - 6th Edition


 Calculus: Early TranscendentalsCalculusISBN:9781285741550Author:James StewartPublisher:Cengage Learning
 Thomas' Calculus (14th Edition)CalculusISBN:9780134438986Author:Joel R. Hass, Christopher E. Heil, Maurice D. WeirPublisher:PEARSON
 Calculus: Early Transcendentals (3rd Edition)CalculusISBN:9780134763644Author:William L. Briggs, Lyle Cochran, Bernard Gillett, Eric SchulzPublisher:PEARSON
 Calculus: Early TranscendentalsCalculusISBN:9781319050740Author:Jon Rogawski, Colin Adams, Robert FranzosaPublisher:W. H. Freeman
 Calculus: Early Transcendental FunctionsCalculusISBN:9781337552516Author:Ron Larson, Bruce H. EdwardsPublisher:Cengage Learning