
Concept explainers
Videos
(a)
To graph: For the function
(a)
Explanation of Solution
Given information:
The given graph of the derivative

Figure (1)
Graph:
The graph of
All the local extremes,
The plot for local extremes is shown in figure (2).
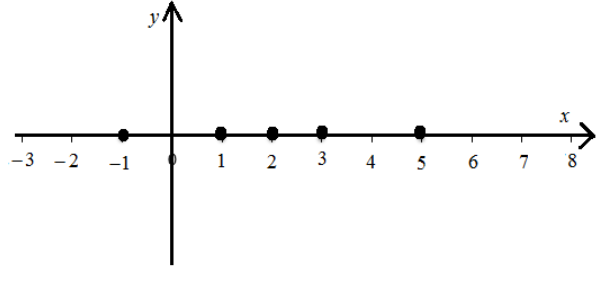
Figure (2)
The plot for
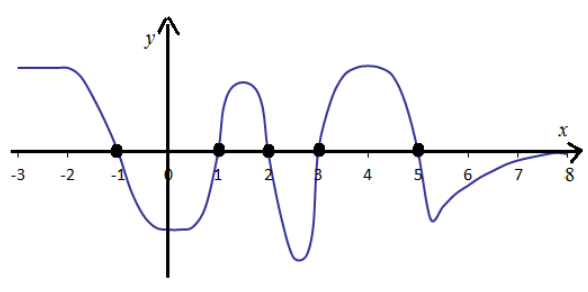
Figure (3)
Interpretation: Graph for the function
(b)
To graph: For the function
(b)
Explanation of Solution
Given information:
The given graph of the derivative
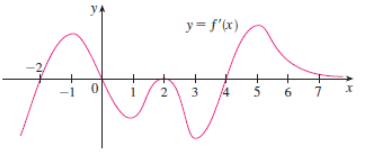
Figure (1)
Graph:
The function
While it is increases when
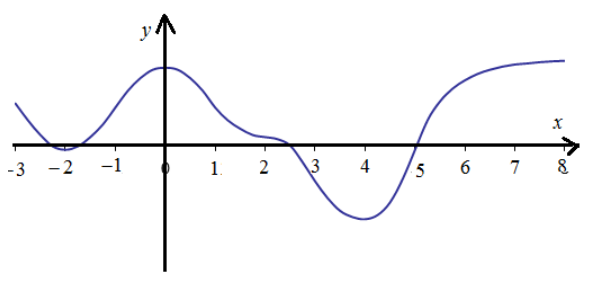
Figure (4)
Interpretation: Graph for the function
Chapter 2 Solutions
Single Variable Calculus: Concepts and Contexts, Enhanced Edition


 Calculus: Early TranscendentalsCalculusISBN:9781285741550Author:James StewartPublisher:Cengage Learning
 Thomas' Calculus (14th Edition)CalculusISBN:9780134438986Author:Joel R. Hass, Christopher E. Heil, Maurice D. WeirPublisher:PEARSON
 Calculus: Early Transcendentals (3rd Edition)CalculusISBN:9780134763644Author:William L. Briggs, Lyle Cochran, Bernard Gillett, Eric SchulzPublisher:PEARSON
 Calculus: Early TranscendentalsCalculusISBN:9781319050740Author:Jon Rogawski, Colin Adams, Robert FranzosaPublisher:W. H. Freeman
 Calculus: Early Transcendental FunctionsCalculusISBN:9781337552516Author:Ron Larson, Bruce H. EdwardsPublisher:Cengage Learning