
Concept explainers
Videos
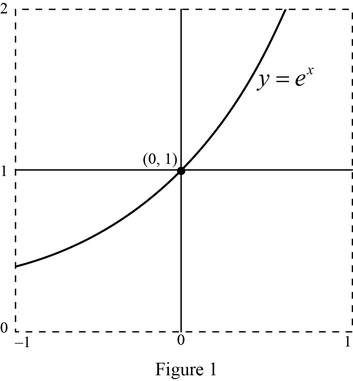
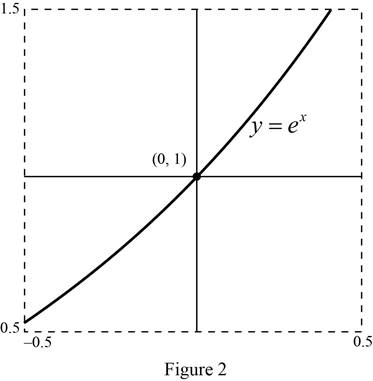
Graph the curve y = ex in the viewing rectangles [ – 1, 1] by [0, 2], [–0.5, 0.5] by [0.5, 1.5], and [–0.1, 0.1] by [0.9, 1.1]. What do you notice about. the curve as you zoom in toward the point (0,1)?
To sketch: The graph of the curve
Explanation of Solution
Graph:
Use the online graphing calculator to draw the graph of the function
Graph:
Use the online graphing calculator to draw the graph of the function
Graph:
Use the online graphing calculator to draw the graph of the function
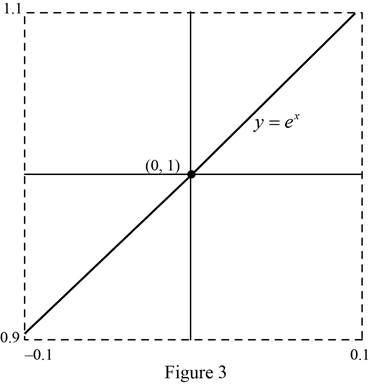
Observe that the graphs, the curve looks almost like a straight line as viewing rectangle toward the point
Chapter 2 Solutions
Single Variable Calculus: Concepts and Contexts, Enhanced Edition


 Calculus: Early TranscendentalsCalculusISBN:9781285741550Author:James StewartPublisher:Cengage Learning
 Thomas' Calculus (14th Edition)CalculusISBN:9780134438986Author:Joel R. Hass, Christopher E. Heil, Maurice D. WeirPublisher:PEARSON
 Calculus: Early Transcendentals (3rd Edition)CalculusISBN:9780134763644Author:William L. Briggs, Lyle Cochran, Bernard Gillett, Eric SchulzPublisher:PEARSON
 Calculus: Early TranscendentalsCalculusISBN:9781319050740Author:Jon Rogawski, Colin Adams, Robert FranzosaPublisher:W. H. Freeman
 Calculus: Early Transcendental FunctionsCalculusISBN:9781337552516Author:Ron Larson, Bruce H. EdwardsPublisher:Cengage Learning