
Concept explainers
Videos
Sketch the graph of the function and use it to determine the values of a for which
To sketch: The graph of
Explanation of Solution
Given:
The function
Graph:
Draw the graph of
Draw the graph of 1 + sin x curve to the left of vertical axis since the interval is restricted that x < 0. Then draw the cosine curve between the interval
The graph of
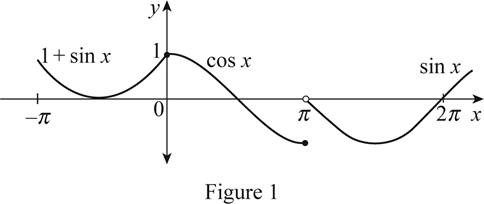
From Figure 1, it is observed that the graph of
Also notice that,
Hence,
Therefore, it can be concluded that
Chapter 2 Solutions
Single Variable Calculus: Concepts and Contexts, Enhanced Edition
Additional Math Textbook Solutions
University Calculus
Calculus For The Life Sciences
Precalculus: Concepts Through Functions, A Unit Circle Approach to Trigonometry (4th Edition)
Calculus and Its Applications (11th Edition)
Thomas' Calculus: Early Transcendentals (14th Edition)
Finite Mathematics and Calculus with Applications (10th Edition)


 Calculus: Early TranscendentalsCalculusISBN:9781285741550Author:James StewartPublisher:Cengage Learning
 Thomas' Calculus (14th Edition)CalculusISBN:9780134438986Author:Joel R. Hass, Christopher E. Heil, Maurice D. WeirPublisher:PEARSON
 Calculus: Early Transcendentals (3rd Edition)CalculusISBN:9780134763644Author:William L. Briggs, Lyle Cochran, Bernard Gillett, Eric SchulzPublisher:PEARSON
 Calculus: Early TranscendentalsCalculusISBN:9781319050740Author:Jon Rogawski, Colin Adams, Robert FranzosaPublisher:W. H. Freeman
 Calculus: Early Transcendental FunctionsCalculusISBN:9781337552516Author:Ron Larson, Bruce H. EdwardsPublisher:Cengage Learning