
Concept explainers
Videos
To sketch: A rough graph of the temperature of the water as a function of the elapsed time.
Explanation of Solution
Given:
Some ice cubes are put in a glass filled with cold water and then it is placed on the table and cooled.
Observation:
Let the time in x-axis and the temperature in y-axis. Initially when ice cubes are put in a glass filled with cold water, the temperature of water is freeze as ice melts. And then the temperature increased and reaches the room temperature as the ice melted. Thus, the rough graph of the temperature of the pie as a function of time is shown below in Figure 1.
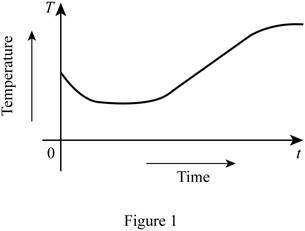
From Figure 1, it is observed that the temperature is decreasing at the beginning, remains constant in the middle and then increasing and reaches the room temperature.
Chapter 1 Solutions
Single Variable Calculus: Concepts and Contexts, Enhanced Edition


 Calculus: Early TranscendentalsCalculusISBN:9781285741550Author:James StewartPublisher:Cengage Learning
 Thomas' Calculus (14th Edition)CalculusISBN:9780134438986Author:Joel R. Hass, Christopher E. Heil, Maurice D. WeirPublisher:PEARSON
 Calculus: Early Transcendentals (3rd Edition)CalculusISBN:9780134763644Author:William L. Briggs, Lyle Cochran, Bernard Gillett, Eric SchulzPublisher:PEARSON
 Calculus: Early TranscendentalsCalculusISBN:9781319050740Author:Jon Rogawski, Colin Adams, Robert FranzosaPublisher:W. H. Freeman
 Calculus: Early Transcendental FunctionsCalculusISBN:9781337552516Author:Ron Larson, Bruce H. EdwardsPublisher:Cengage Learning